
Tutorial
|
In this part we shall have a look at the evolution of money and the various exchange rate systems prevailing till the middle of the 20th century. The exchange of goods and services has been prevalent since thousands of years and a system of barter developed over the years as man looked for ways to fulfill his needs for different commodities and services. The initial exchange was limited to items of food and gradually as man explored, invented and traveled to distant land it became necessary to have a medium of exchange. This necessity led to the evolution of money. The Evolution of money Primitive societies used various commodities as a medium of exchange. These ranged from grain, shells, tobacco, rice, salt, ivory to cattle, sheep, skins and slaves. These were the commodities, which were in greater demand and were thus easy to exchange. However, while a farmer could easily meet his requirements for various goods by offering his wheat, a person having cattle would find it difficult to exchange it for salt. He would either have to take a very large quantity or take some other easily traded commodity. Thus the marketability of a commodity determined its acceptance and use as a means of exchange. Marketability of a commodity was determined by the familiarity with the commodity and its quality, divisibility, uniformity and ease of transportation and storage. Over time, with the introduction of metals and coins, another important quality of the commodity emerged. It became a medium of exchange, having a value much greater than its intrinsic value. It was no longer used for consumption, but for acquiring other commodities for consumption. This was the evolution of ‘money’. The use of coins facilitated exchange as it was easy to determine the value of a unit, was easily divisible and acceptable to all. Two metals, gold and silver were favoured for minting of coins because of their intrinsic value. There however still remained the inconvenience of carrying a large amount of coins or bullion and it was not easy to transfer or transport large amounts. It was in the 17th century that the practice of depositing coins and bullion with goldsmiths, moneychangers, mint masters etc started. These persons enjoyed the trust of the people and were entrusted with the job of safe keeping of surplus money. The next step was the transfer of value by assignment rather than by physical delivery. Goldsmiths in England were among the first to start the system of money by book entry. This was a major development and ultimately led to the spread of banking services. People were confident that they would receive a certain value, on demand, against the bank note they possessed. The history of foreign exchange can be traced back to the time moneychangers in the middle east would exchange coins from all over the world. Foreign exchange dealings with gold as the standard of value started around 1880 after more than a hundred years of bimetallism where both gold and silver were commonly used as a measure of value. The Gold Standard Under the gold standard, the exchange rate of two currencies was based on the intrinsic value of gold in the unit of each currency. This also came to be known as the mint parity theory of exchange rates. Under the gold standard exchange rates could only fluctuate within a narrow band known as the upper and lower gold points. A country, which had a balance of payments deficit had to part with some of its gold and transfer it to the other country. The transfer of gold would reduce the volume of money in the deficit country and lead to deflation while the inflow of gold in the surplus country would have an inflationary impact on that economy. The country which was in deficit would then be able to export more and restrict its imports as a result of the fall in domestic prices and reduce its BOP deficits. A lowering of the discount rates in a country with a surplus and a hike in discount rates in the deficit country also aided in reducing the imbalance in the BOP. The main types of gold standard were: § The gold specie standard. § The Gold Bullion standard. § The Gold Exchange standard. The Gold Specie Standard – 1880 – 1914 Under the gold specie standard, gold was recognized as a means of settling domestic as well as international payments. There were no restrictions on the use of gold and it could be melted down or be sent to a mint for conversion to coins. Import and export of gold was freely allowed and Central Banks guaranteed the issue or purchase of gold at a fixed price, on demand. The price of gold varied according to the supply of the metal in the market and the value of gold coins was based on their intrinsic value. The Gold Bullion Standard – 1922 - 1936 The gold bullion standard started after the first world war, as increased expenditures to fund the war effort exposed the weaknesses of the gold standard. It was decided at an international conference in Brussels in 1922 to reintroduce the gold standard but in a modified form. Under the gold bullion standard, paper money was the main form of exchange. It could however be exchanged for gold at any time. As it was unlikely that there would be a great demand for converting currency notes to gold at any given time, the banks could issue currency notes in excess of the value of gold they were holding. The gold bullion standard too could not last long as many major currencies were highly over or under valued leading to a distortion in balance of payment positions. In 1925, the sterling was over valued against the dollar by nearly 44% and necessitated a devaluation. This devaluation had an impact on other currencies too and led to an exchange rate war. England withdrew from the gold standard in 1931, America in 1933 and Italy, France, Belgium, Switzerland and Holland remained. It finally collapsed in 1936 with the devaluation of the French franc and the Swiss franc. The Gold Exchange Standard – 1944- 1970 During the second world war, international trade suffered with runaway inflation and devaluation of currencies. A need was felt to bring out a new monetary system that would be stable and conducive to international trade. The process was started in 1943 by Britain and the US and finally in July 1944 the American proposal was accepted at the Bretton Woods conference. The new system aimed to bring about convertibility of all currencies, eliminate exchange controls and establish an international monetary system with stable exchange rates. The IMF was set up in 1946 under the Bretton Woods agreement and the new exchange rate system also came to be known as the Bretton Woods system. Under the Bretton Woods system, member countries were required to fix parities of their currencies to gold or the US dollar and ensure that rates did not fluctuate beyond 1% of the level fixed. It was also agreed that no country would effect a change in the parity without the prior approval of the IMF |
|
Introduction: Interest rate swaps are used to hedge interest rate risks as well as to take on interest rate risks. If a treasurer is of the view that interest rates will be falling in the future, he may convert his fixed interest liability into floating interest liability; and also his floating rate assets into fixed rate assets. If he expects the interest rates to go up in the future, he may do vice versa. Since there are no movements of principal, these are off balance sheet instruments and the capital requirements on these instruments are minimal. Definition: A contract which involves two counter parties to exchange over an agreed period, two streams of interest payments, each based on a different kind of interest rate, for a particular notional amount. Mechanism of an Interest Rate Swap: Take the case of an interest rate swap, in which Counter Party A and Counter Party B agree to exchange over a period of say, five years, two streams of semi-annual payments. The payments made by A are calculated at a fixed rate of 6% (Fixed rate) per annum while the payments to be made by B are to be calculated using periodic fixings of 6-month Libor (floating). The swap is for a notional principal amount of USD 10 million. The above swap is called the "plain vanilla" or the "coupon swap". Interest rates are normally fixed at the beginning of the contract period, but settled at the end of the period. The contract can be simplified as follows. Counter parties:: A and B Maturity:: 5 years A pays to B : 6% fixed p.a. B pays to A : 6-month LIBOR Payment terms : semi-annual Notional Principal amount: USD 10 million. Diagram: Cash flows in the above swap are represented as follows:
Typical Characteristics of the Interest Rate Swaps: 1. The principal amount is only notional. 2. Opposing payments through the swap are normally netted. 3. The frequency of payment reflects the tenor of the floating rate index. What is a Coupon Swap? If an interest rate swap involves the swapping of a stream of payments based on the fixed interest rate for a stream of floating interest rate, then it is called a coupon swap. Counter parties to the Coupon Swap: Payer of the fixed interest stream is called the Payer in the swap. Receiver of the fixed interest stream is called the Receiver in the Swap. Diagram: What is a generic swap? The term generic is used to describe the simplest of any type of financial instrument – plain vanilla. So, a plain vanilla swap can be called a generic swap. Typically, generic swaps contain the simple characteristics, such as a constant notional principal amount, exchange of fixed against floating interest (coupon swap), an immediate start (i.e., on the spot date). A simple coupon swap can be called a generic swap. What is a Basis Swap? Two streams of payments can be calculated using different floating rate indices. These are called basis swaps or floating-against-floating swaps. a. It is possible to enter into a swap with a 3-month Libor against a 6-month Libor. b. It is also possible to enter into a swap with a 91-Day T-Bill Yield against a 6-Month Libor. Basis index swaps come under the classification of non-generic swaps. Counterparties to a basis swap: In a basis swap, each counter party is described in terms of both the interest stream it pays and the interest stream it receives. Diagram: Asset Swap: If in an interest rate swap, one of the streams of payments being exchanged is funded with interest received on an asset, the whole mechanism is called the asset swap. In other words, it is an interest rate swap, which is attached to an asset. It does not however involve any change in the swap mechanism itself. Asset swaps are used by investors. If an investor anticipates a change in interest rates, he can maximize his interest inflow by swapping the fixed interest paid on the asset for floating interest, in order to profit from an expected rise in interest rates. Money Market Swaps Swaps with an original maturity of upto two years are referred to as Money Market swaps. IMM swaps come under this category. The tenor of the swaps matches exactly with the short-term interest futures in the IMM (International Monetary Market- Traded in the Chicago Mercantile Exchange). Term Swaps A swap with an original tenor of more than two years is referred to as a term swap. What does an Interest Rate Swap do? Interest rate swaps can be used to take on fresh interest rate risk as well as to manage existing interest rate risk. Interest Rate swaps without offsetting underlying create interest rate risk. : Each counter party in an interest rate swap is committed to pay a stream of interest payments and receive a different stream of interest payments. A payer of fixed interest rate payments is exposed to the risk of falling interest rates, while a payer of floating interest rate payments is exposed to the risk of rising interest rates. Similarly, a receiver of fixed interest rate payments is exposed to the risk of rising interest rates while the receiver of floating interest payments is exposed to the risk of falling interest rates. To summarize, interest rate swaps create an exposure to interest rate movements, if not offset by an underlying exposure. Interest rate swaps can be used to hedge interest rate risk: Floating rate loans expose the debtor to the risk of increasing interest rates. To avoid this risk, he may like to go for a fixed rate loan, but due to the market conditions and his credit rating, his fixed rate loans are available only at a very high cost. In that case, he can go for a floating rate liability and then swap the floating rate liability into a fixed rate liability. He can do the swap with another counter party whose requirements are the exact opposite of his or , as is more often the case, can do the swap with a bank. The following diagram illustrates the case in which an intermediary, e.g. a bank, is involved in a swap deal between two counter parties. Borrower A has a floating rate loan, but would prefer a fixed rate loan. There is another borrower B who has a fixed rate loan, but would prefer a floating rate loan. The intermediary can now match these two borrowers as described in the following diagram. Diagram: Example: A manufacturing company embarks on a project for which it borrows USD 4 million working capital on a floating interest rate basis, payable quarterly for two years. Since the treasurer of the company felt that the floating rate payments will involve serious risks, he decides to enter into a swap with a bank and convert the same into a fixed rate loan. The bank now swaps the floating rate payments into a fixed rate at 12%. The resultant cash flow arising out of the transaction is illustrated below.
Getting comparative advantage in different markets: Various segments of the capital markets differ in terms of how sensitive they are to differences in the creditworthiness of the issuers. Particularly, in bond markets, where retail investors play an important role and tend to be averse to default risk, disproportionately higher yields are offered to them to invest in less creditworthy bonds. Issuers with a lower rating find themselves paying more than the issuers enjoying a stronger rating. Often, we find that cost of funds is higher in the bond markets than in the credit markets. Whenever, these differences occur in different markets, it would be possible to arbitrage between the markets. Let us take the following example Consider two companies, rated AAA and BBB. AAA has a higher credit rating than BBB. Both companies can raise funds either by issuing fixed-interest bonds or by taking bank loans (at a floating interest rate). Their borrowing costs are:
Assume now that AAA wants to raise floating rate money and BBB wants to raise fixed rate money. It will be realized that the advantage (200 basis points) of AAA raising fixed rate money in the bond market as against BBB, which is, is greater than the disadvantage (60 basis points) of letting BBB raise floating rate money in the credit market. There is a comparative advantage of 140(200-60) basis points. Both the parties can share the difference and reduce their borrowing costs. A Banker normally acts as an intermediary and arranges most of these deals. A share of the advantage is passed on to the banker. In this case, if the three parties agree to share the difference as 80:40:20 basis points, then AAA will receive 9.80% fixed from the bank in exchange for Libor, while paying 10.00% on his bonds. The net outcome for AAA is a floating rate liability at Libor+20 bps. This represents a gain of 80 basis points, than if he had borrowed at Libor+100 bp. Similarly Borrower BBB receives Libor in lieu of 10.00% fixed while paying Libor+160 bp to his creditor. The net effect is equivalent to paying 11.60% fixed, which represents a 40 basis points gain over fixed rate borrowing at 12.00%. The intermediary bank receives 10.00% fixed from BBB and pays 9.80% fixed to AAA in effect gaining 20 basis points on this transaction. The following diagram illustrates the transaction. Interest Rate Swaps in India: With a view to deepening the money market and also to enable banks; primary dealers and all-India financial institutions to hedge interest rate risks, the Reserve Bank of India has allowed scheduled commercial banks, primary dealers and all-India financial institutions to make markets in Interest Rate swaps from July 1999. However, the market which has taken off seriously so far, is the one based on Overnight Index Swaps(OIS). Benchmarks of tenor beyond overnight have not become popular due to the absence of a vibrant inter bank term money market. The NSE publishes MIBOR(Mumbai Interbank Offered Rate) rates for three other tenors viz., 14-day, 1month and 3 month. The other longer tenor benchmark that is available is the yield based on forex forward premiums. This is called MIFOR(Mumbai Interbank Forward Offered Rate). Reuters published 1m,3m,6m 1yr MIFORs are the market standard for this benchmark. Definition and Mechanism of Overnight Index Swap: The Overnight Index Swap (OIS) is an INR interest rate swap where the floating rate is linked to an overnight inter bank call money index. The swap will be flexible in tenor i.e. there is no restriction on the tenor of the swap. The interest would be computed on a notional principal amount and settled on a net basis at maturity. On the floating rate side, the interest amounts are compounded on a daily basis based on the index. At the moment, the NSE O/N Mibor is the most widely used floating rate index, the Reuters O/N Mibor being the other used. Example: Bank A is a fixed rate receiver for INR 5 crores for a period of one week at 10% and Bank B is a receiver of floating rate linked to the Overnight index. The NSE Mibor rates for the seven days are taken and settled at the end of the swap period. At the end of the period of one week, i.e., the 8th day, Bank B will have to pay to Bank A Rs. 95890/- (being interest on Rs. 5 crores for 7 days at 10%) and has to receive from A Rs. 97508/-. The payments are netted and the only payment that takes place is a payment by A of Rs. 1,608 (97508 – 95890) to B.
|
|||||||||||||||||||||||||||||||||||||||||||||||||||||||||||||||||||||||||||||||||||||||||||||||||||||||||||||||||||||||||||||||||||||||||||||||||
|
Introduction: Currency swaps involve an exchange of cash flows in two different currencies. It is generally used to raise funds in a market where the corporate has a comparative advantage and to achieve a portfolio in a different currency of his choice, at a cost lower than if he accessed the market of the second currency directly. However, since these types of swaps involve an exchange of two currencies, an exchange rate, generally the prevailing spot rate is used to calculate the amount of cash flows, apart from interest rates relevant to these two currencies. By its special nature, these instruments are used for hedging risk arising out of interest rates and exchange rates. Definition: A currency swap is a contract which commits two counter parties to an exchange, over an agreed period, two streams of payments in different currencies, each calculated using a different interest rate, and an exchange, at the end of the period, of the corresponding principal amounts, at an exchange rate agreed at the start of the contract. Consider a swap in which: Bank UK commits to pay Bank US, over a period of 2 years, a stream of interest on USD 14 million, the interest rate is agreed when the swap is negotiated; in exchange, Bank US commits to pay Bank UK, over the same period, a counter stream of sterling interest on GBP 10 million; this interest rate is also agreed when the swap is negotiated. Bank UK and Bank US also commit to exchange, at the end of the two year period, the principals of USD 14 million and GBP 10 million on which interest payments are being made; the exchange rate of 1.4000 is agreed at the start of the swap. We can now see from the above that currency swaps differ from interest rate swaps in that currency swaps involve:
If in the above-mentioned swap, the two banks agree to exchange the principal at the beginning.
Cross-currency coupon swaps: These are fixed-against-floating swaps. Diagram: Cross-currency basis swap: These swaps involve payments attached to a floating rate index for both the currencies. In other words, floating-against-floating cross-currency basis swaps. Diagram: Risk Management with currency swaps: Example: (Principal exchanged at Maturity) A UK Co. With mainly sterling revenues, has borrowed fixed-interest dollars in order to purchase machinery from the U.S. It now expects the GBP to depreciate against the USD and is worried about increase in its cost of repayment. It could now hedge its exposure to a dollar appreciation by using a GBP/USD currency swap. It would fix the rate at which the company, at maturity, could exchange its accumulated sterling revenues for the dollars needed to repay the borrowing. Fixing the exchange rate hedges the currency risk in borrowing dollars and repaying through sterling. Assuming, the Company expects not only the dollar to appreciate, but also the GBP interest rates to fall. It could take advantage of this situation, by swapping from fixed-interest dollars into floating interest sterling. Diagram: Stages:
This will be the case when the UK co. wants to swap its dollar loan into a sterling loan, but needs dollars at the outset to pay for dollar imports or for any other purpose. In this case, the UK co. would simply acquire the dollars from the spot foreign exchange market. It would fund this spot purchase of dollars with the sterling received through the swap in the initial exchange of principal amounts. Diagram: Stages:
Swap Market in India. In India, the Reserve Bank of India has permitted banks to arrange currency swaps with one currency leg being Indian Rupee. However, the USD/INR forward foreign exchange markets are illiquid beyond one year. Since currency swaps involve the forward foreign exchange markets also, there are limitations to entering the Indian Rupee currency swaps beyond twelve months. Moreover, banks are also not allowed to take risk /run open swap books i.e., they have to locate counter parties with matching requirements; e.g. one desiring to swap a dollar liabilities into rupee liabilities and the other wishing to exchange rupee debt servicing obligation for dollar obligations. However, some aggressive banks do provide quotes for currency swaps for three to five years out for reasonable size transactions.Corporates who have huge rupee liabilities and want have foreign currency loans in their books, both as a diversification as well as a cost reduction exercise could achieve their objective by swapping their rupee loans into foreign currency loans through the dollar/rupee swap route. However, the company is assuming currency risk in the process and unless carefully managed, might end up increasing the cost of the loan instead of reducing it. In India, it is more the norm for corporates to swap their foreign currency loans into rupee liabilities rather than the other way round. Example: A corporate has a loan of USD 10 million outstanding with remaining maturity of 2 years, interest on which is payable every six months linked to 6-month Libor + 150 basis points. This dollar loan can be effectively converted into a fixed rate rupee loan through a currency swap. If the corporate wants to enter into a currency swap to convert his loan interest payments and principal into INR, he can find a banker with whom he can exchange the USD interest payments for INR interest payments and a notional amount of principal at the end of the swap period. The banker quotes a rate of say 10.75% for a USD/INR swap. The total cost for the corporate would now work out to 12.25%. If the spot rate on the date of transaction is 44.65, the rupee liability gets fixed at Rs. 446.50 mio. At the end of the swap, the bank delivers USD 10 million to the corporate for an exchange of INR 446.50 mio, which is used by the corporate to repay his USD loan. The corporate is able to switch from foreign currency. |
|
Basics A Forward Rate Agreement (FRA) is an agreement between two parties that determines the forward interest rate that will apply to an agreed notional principal (loan or deposit amount) for a specified period. FRAs are basically OTC equivalents of exchange traded short date interest rate futures, customized to meet specific requirements. FRAs are used more frequently by banks, for applications such as hedging their interest rate exposures, which arise from mis-matches in their money market books. FRA’s are also used widely for speculative activities. Characteristics of FRAs
An Example A corporate with a $10 million floating rate exposure with rollovers to be fixed by reference to the 6-month USD LIBOR rate expects the short-term interest rates to increase. The next rollover date is due in 2 months. The corporate calls his banker and asks for a 2-8 USD FRA quote (6 month LIBOR 2 months hence). The bank quotes a rate 6.68 and 6.71 (see FRA table below). The customer locks the offered rate 6.71 (borrows at a higher rate). Calculations If the 6-month LIBOR 2 months from now rises by 100 basis points to 7.71 the bank pays the corporate according to the BBA formula (L-R) or (R-L) x D x A [(B x 100) + (D x L)] where: L = Settlement rate (LIBOR) R = Contract reference rate D = Days in the contract period A = Notional principal amount B = Day basis (360 or 365) Note: Choose (L-R) or (R-L) so that the difference is positive Therefore the bank would pay the corporate (7.71 – 6.71) x 181 x $10 million = $48,401.53 [(360 x 100) + (181 x 7.71)] If interest rates had fallen by 100 basis points the corporate would have to compensate the bank by an equivalent amount. The result from this formula can also be obtained intuitively as follows: The interest gain from entering the FRA is calculated as 1% x $10million x 181/360 = $50,277.78 The present value of $50,277.78 for a 6-month period discounted by the Settlement Rate (LIBOR) is: $50,277.78 / {1+[7.71% x 181/360]} = $48,401.53 The (D x L) factor in the denominator of the BBA formula is the present value of the compensation at the settlement rate. The compensation amount in the above example is therefore discounted at 7.71 for the six-month period. This reflects the fact that the FRA payment is received at the beginning of the period (settlement date) and the party is therefore in a position to earn interest on it. The 6-month loan payment however is payable at the end of the period. British Bankers’ Association’s recommended terms The BBA set up standards for FRA agreements, known as BBAFRA terms, to provide recommended terms and conditions for FRA contracts to provide guidance on market practice. Banks not dealing on BBA terms have to make it clear to the counterparty that the FRA is not governed by these terms. FRA Terminology
Quotes Prices of FRAs are quoted the same way as money market rates, i.e. as an annualized percentage. FRAs are written as 3-6, 2.8, 4x10, 6vs9 etc. The first figure denotes the Settlement Date, the last figure the Maturity Date, and the difference between the two figures is the Contract Period. FRAs are sometimes quoted as "offer-bid" rates, the same method of quoting followed by money market rates. The buyer of the FRA therefore gets the higher rate or the market maker’s offered rate since the buyer is a potential borrower. Likewise, the seller or depositor gets the lower rate or the bid rate. The main Contract Periods traded are 3 months and 6 months although 12-month periods are gaining popularity. Broken date prices are also available though the spreads maybe wider and may take longer to obtain. Contract periods less than 3 months are difficult to obtain due to the nature of FRA trading (slim profit margins make it uneconomical). Value dates for FRAs follow the dates applicable to money markets (called "straight dates"). Trading lots are usually good for 5 million units of the currency (yen excepted). Settlement The compensating amount reflects the difference between the actual/Settlement Rate for the period and the Contract Rate. The Settlement Rate, according to the BBA definition, is the rate calculated by taking the rates quoted by eight BBA Designated Banks as being in their view the offered rate at which deposits in the Contract Currency for such Contract Period are being quoted to prime banks in the London interbank market at 11.00 a.m. on the relevant Fixing Date for Settlement Date value. The two highest and the two lowest rates are eliminated and the remaining of the four rates are averaged and then rounded upwards to five decimal places. In the event that the Settlement Rate is higher than the Contract Rate the borrower would receive payment from the seller. Conversely, the depositor would receive the compensating amount if the interest rates fall. Settlement of the compensating amount takes place at the beginning of the FRA. The first date of the Contract Period is defined as the Settlement Date. Euro FRAs rates are fixed two days ahead of the Settlement Date. As the payment is an upfront payment the Compensating Amount is a discounted amount. The actual/discount rate used to calculate the Compensating Amount is taken as LIBOR or the offer rate of the money market quote. For market makers (usually banks) who expect to deposit at the offer rate and buyers of FRAs this method of discounting is not a problem. Sellers of the FRA will be disadvantaged if they place their deposits on the bid side of the quote and therefore will not be hedged at the Contract Rate. Their effective hedge will be lower by the spread between the quotes (usually 1/8%). Applications Hedging future interest rate exposure is the predominant use of a FRA. Banks hedge their money market mis-matches and corporates for future borrowings/deposits. Arbitrage between FRAs and short-term interest rate futures provide a good opportunity to banks. These short-term futures contracts provide a good source of hedging for FRA market makers. Arbitrage between FRAs and forward-forward rates in the cash markets may be theoretically possible but rarely seen in practice. Speculation in FRAs is attractive, as there are no transaction fees involved. This type of activity is usually confined to banks. Conclusion There are many variations to the traditional FRAs and are gaining popularity. These include –
FRAs can be priced off forward to forward interest rates. These forward to forward rates can be obtained from the cash market yield curve or by the implied forward rates available from the interest rate futures market in the relevant currency. Banks have recently started to quote FRA prices in the Indian currency. Forward rates can be constructed from securities of different maturities. FRAs in rupee can be synthetically created using the USD FRA in conjunction with rupee forwards in the foreign exchange markets or rupee interest rate swaps against MIBOR. However, forward rates in the foreign exchange markets are liquid upto 12 months only. For example, suppose an Indian corporate is to issue a 6-month commercial paper. The current 3-month CP rates are 10.80 and the 6-month rates are 11.50. The corporate is of the view that the 6-month rates are high and is of the view that the rates should fall in the near term. The corporate could then sell a 3x6 FRA. If the rates do fall the corporate would receive the compensating amount from his bank therefore reducing his borrowing cost. Alternatively the corporate could issue a 3-month CP at 10.80%, lock in the 3x6 FRA rate, and issue another 3-month CP after 3 months (this strategy assumes the CP issuance costs involved are negligible). The Indian bank in turn could hedge his exposure in the forward markets by paying (borrowing) 6-month forward and receiving (lending) 3-month forward. Typical trading lot size would be 10 crores although 5 crores may be acceptable. FRA quotes from Reuters TOPFRA page
|
||||||||||||||||||||||||||||||||||||||||||||||||||||||||||||||||||||||||||||||||||||||||||||||||||||||||||||||||||||||||||||||||||||||||||||||||||||||||||||||||||||||||
Contrast with Fundamental analysis
Assumptions in technical analysis
Price classification
Types of charts
Trend
Trend Reversal
Trendlines
Fibonocci Retracement Analysis
Head and Shoulders Reversal Pattern
Double Top Reversal Pattern
Calculation
Interpretation
Bollinger Bands
Interpretation
Oscillators
Momentum
Interpretation
Relative Strength Index (RSI)
Construction
RSI overbought/oversold levels
RSI signals
Stochastics
Construction
Stochastic signals
Summing Up
|
Japanese CandlesticksCandlestick patterns 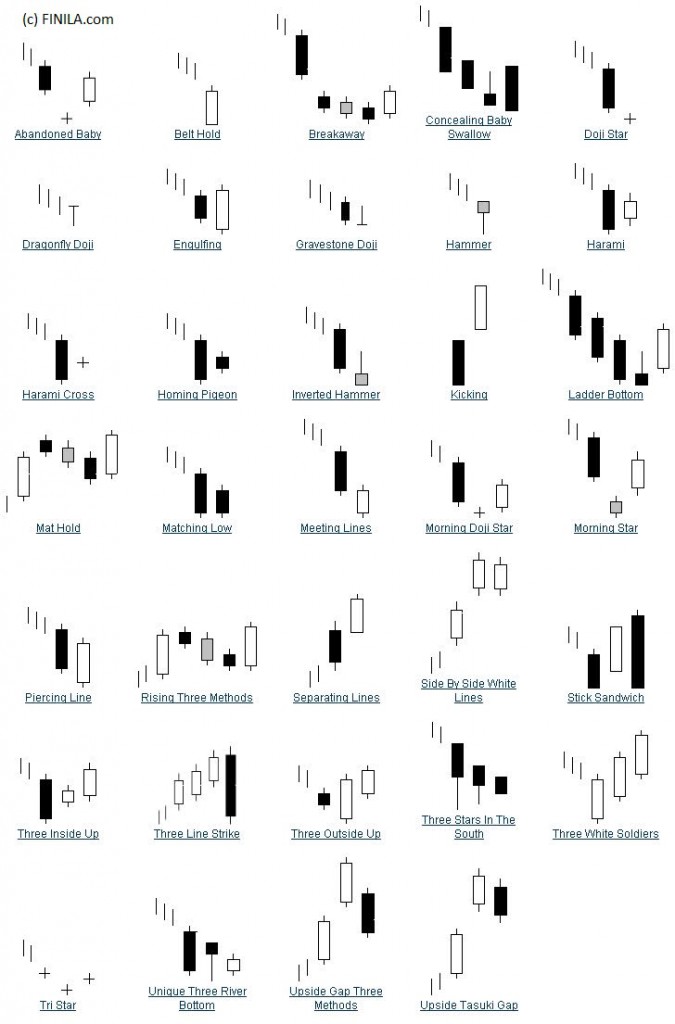
Source: Finila.com Abandoned Baby: This is a rare reverse pattern characterized by a gap followed by a Doji, which is after that followed by another gap in the opposite direction. The shadows on the Doji must completely gap either below or above the shadows of the 1st and 3rd day. Doji: The pattern called ‘Doji’ forms when securities’ both open and close levels are virtually equal. The length of the upper and lower shadows can be various, which results in candlesticks looking like either cross, inverted cross, or plus sign. Doji can be interpreted as a note of indecision or tug-of-war between buyers and sellers during the trading day. Prices can move both above and below the opening levels during certain period and at the end they close either at or close to the opening levels. Dark Cloud Cover: A bearish reverse pattern that supports the uptrend by a long white body. On the next day it opens at a new high and afterwards closes below the midpoint of the first day’s body. Downside Tasuki Gap: A continuation pattern with a long black body followed by another black body, which has gapped below the first one. The 3rd day consist of white body and opens within the body of the previous day, then closes in the gap between the first two days, but does not close the gap. Dragonfly Doji: This pattern is a kind of Doji forming when the open and close prices are at the high of the day. Like on the other Doji days, this one normally appears at market turning points. Engulfing Pattern: A reverse pattern that can be either bearish or bullish, which depends on whether it appears at the end of an uptrend (bearish engulfing pattern) or a downtrend (bullish engulfing pattern). The first day is characterized by a small body, after which follows a day whose body completely engulfs the body of the previous day. Evening Doji Star: A three day bearish reverse pattern that is similar to the Evening Star. The uptrend continues with a large white body. The next day it opens higher, moving in a small price range and then closes at its open (Doji). On the 3rd day it closes below the midpoint of the first day’s body. Evening Star: A bearish reverse pattern that supports an uptrend with a long white body day, followed by a gapped up small body day, then a down close with the close below the first day’s midpoint. Three Falling Methods: This is a bearish continuation pattern. A long black body is followed by three small body days, each fully contained in the range of the high and low of the first day. The 5th day closes at a new low. Gravestone Doji: A Doji line that forms when the Doji is at, or very near the low of the day. Hammer: Hammer candlesticks form when a security moves significantly lower after the open, but closing well above the intraday low. The result is that candlestick looks like a square lollipop with a long stick. If this candlestick forms during a decline, then it is called a Hammer. Hanging Man: This type of candlestick forms when a security moves significantly lower after the open, but it closes well above the intraday low. As the result the candlestick looks like a square lollipop with a long stick. Provided that this candlestick forms during an advance, it is called a Hanging Man. Harami: A two day pattern which has a small body of the second day completely contained within the range of the previous body, and is in the opposite colour. Harami Cross: A 2-day pattern that is similar to the Harami. The difference is that the pattern on the second day is Doji. Inverted Hammer: It is a one day bullish reverse pattern. In a downtrend, the open is lower, after that it trades higher but closes near its open and as a result looking like an inverted lollipop. Long Day: The long day represents a large price move from open to close, where the length of the candlestick body is long. Long-Legged Doji: This candlestick consists of long upper and lower shadows with the Doji in the middle of the day’s trading period, clearly reflecting the indecision of traders. Long Shadows: Candlestick with a long upper shadow and short lower shadow indicates that buyers dominated during the first part of the period, pushing prices higher. Conversely, candlesticks with long lower shadows and short upper shadows indicate that sellers were dominating during the first part of the period, driving prices lower. Marubozu: A candlestick having no shadows extending from the body at either the open, the close or at both of them. The name of this pattern means close-cropped or close-cut in Japanese, even though other interpretations refer to it as Bald or Shaven Head. Morning Doji Star: A three day bullish reverse pattern which is very similar to the Morning Star. The 1st day is in a downtrend with a long black body. On the next day it opens lower with a Doji that has a small trading range. The 3rd day closes above the midpoint of the first day. Morning Star: A three day bullish reverse pattern that consists of three candlesticks: a black candle with long body extending the current downtrend, a short middle candle that gapped down on the open and a white candle with long body that gapped up on the open and then closed above the midpoint of the body of the first day. Piercing Line: A two day bullish reverse pattern. The first day, in a downtrend, consists of a long black-body day. The next day opens at a new low, afterwards closes above the midpoint of the body of the first day. Three Rising Methods: This is a bullish continuation pattern characterized as a long white body that is followed by three small-body days, each fully contained in the range of the high and low of the first day. On the 5th day it closes at a new high. Shooting Star: A single day pattern, which can appear in an uptrend. After open it moves higher, trades much higher and closes near its open. It looks just like the Inverted Hammer except that it is bearish. Short Day: This pattern represents a small price move from open to close, where the candle body length is short. Spinning Top: Candlestick lines that consists of small bodies with upper and lower shadows, which exceed the body length. Spinning tops signal indecision. Stars: It is said that a candlestick that gaps away from the previous candlestick is in star position. Depending on the previous candlestick, the star position candlestick gaps either up or down and appears isolated from previous price action. Stick Sandwich: A bullish reverse pattern with two black bodies which surround a white body. The closing prices of the two black bodies must be equal. A support price is apparent and the opportunity for prices to reverse is pretty good. Three Black Crows: A bearish reverse pattern that consists of three consecutive long black bodies where each day closes at or near its low and opens within the body of the previous day. Three White Soldiers: A bullish reverse pattern consisting of three consecutive long white bodies. Each ought to open within the range of previous body and the close should be near the high of the day. Upside Gap Two Crows: A three day bearish pattern that only appears in an uptrend. The first day is a long white body that is followed by a gapped open with the small black body remaining gapped above the first day. The third day is also a black-body day whose body is larger than the 2nd day and engulfs it. The close of the last day is still above the first long white-body day. Upside Tasuki Gap: A continuation pattern with a long white body that is followed by another white body which has gapped above the first one. The 3rd day is black and opens within the body range of the second day, then closes in the gap between the first two days, but does not close the gap. |