INFORMATION SERVICES
Rates and Reports
Our Price Ticker provides access to real-time rates of all major and minor currencies (spot, cash & Tom discount for USD/INR, forward rates), Equity Indices, Global Commodities and fixed income market. Our research reports provide market update with fundamental and technical analysis at different intervals during the day along with a much sought after fortnightly report by Mr. Jamal Mecklai

FX RISK MANAGEMENT
Market Advisory
We provide FX risk management advisory support that is aligned to the client’s business profile and specific risk management objectives that client has set for its treasury.
FX RISK MANAGEMENT
Customised Risk Management Policy
We have developed close to 500 risk management policies for companies in the widest possible range of industries. The policies we articulate define an end-to end process covering risk identification, risk measurement (benchmark setting and risk limits), risk monitoring, and risk management with specific triggers for hedging.
FX RISK MANAGEMENT
Outsourced Middle Office Support
Ensuring effective implementation of any policy requires an independent middle office. It is often not cost-effective for most mid-sized and even some large companies to set up and staff an independent middle office, so we often provide a middle office outsourcing service where we build the implementation framework in sync with the policy.
FX RISK MANAGEMENT
Outsourced Treasury Operations
In addition to outsourcing the middle office, we also provide a broader treasury outsourcing service that includes liaising with banks where we execute spot, cash and hedge transactions on behalf of the company.
TECHNOLOGY SUPPORT
Mecklai Risk Manager (MRM)
Mecklai Risk Manager (MRM) is a web-based software solution on Dot net platform for treasury risk management. It provides an end-to-end solution with considerable operational flexibility required by the Treasury team for monitoring and reporting of exposures, hedges, trade finance and settlements.
INFORMATION SERVICES
Customized Data feed
We provide an automated and customised market data feed that can be integrated with Client’s ERPs via APIs.
FX RISK MANAGEMENT
Treasury Operations Review
In addition to an audit of treasury processes and monitoring compliance, our reviews also recommend alternate approaches to optimise client’s Treasury function.
CORPORATE SERVICES
Trade Finance
We arrange foreign currency funding at a very competitive rate under different avenues like Buyers’ credit, Suppliers’ credit, Pre and post shipment financing, Factoring and forfeiting etc.
CORPORATE SERVICES
Valuation of Derivatives for Accounts Reporting
For nearly two decades now, we have been providing clients with valuation of derivatives for their accounts reporting. This service is availed by various MNCs, PSUs, custodians, Public Listed and Private limited companies from different industries.
CORPORATE SERVICES
Regulatory Opinions
Having been in the market for well over four decades and with our MD having been on several RBI committees, our understanding of both the importance and content of regulations is well known, and we are often called on to provide opinions in a range of different areas where companies’ business interfaces with regulations.
Over
000
active
relationships
000
Clients with us
for more than 20 yrs
Worked with more than
0
of NIFTY 500
companies
Over
transactions done by
clients annually
Market Indicators
Market Indicators
| Today | 1 Day ago | 1 Week ago | 1 Month ago |
|---|
Updated on 13 Dec, 2025 08:29
Latest Articles
Our Approach to Risk Management
Having advised nearly 5,000 companies over the past 40+ years, we have learned a few critical things about risk management. Each company – and its needs – is unique in terms of its business model, margins, risk appetite, balance between managing cash and managing the accounts, and the management’s general philosophy on risk management. Based on our understanding of these factors we articulate a customized risk management approach for each client which rests on three pillars.
Risk Identification
Know your risk
If the objective is to manage cash flows, Treasury must identify risk out to the longest meaningful tenor, building in elements like the frequency of changes in pricing, the possibility
Read MoreRisk Measurement
Define your boundaries
Once the risk is identified, it is important to define the worst acceptable rate for each exposure – set a ‘Risk Limit’. This risk limit should be set keeping in mind
Read MoreRisk Monitoring and Hedging
Follow a hedge strategy that is not totally dependent on market views
One of the truisms of markets is that it doesn’t matter who you are, how smart you are, or how much experience you have, the market will get the better of you over any reasonable
Read MoreIn addition to providing regular advisory services, we have built and implemented such hedging models for nearly 100 companies over the past 5 years. | |
For implementing this approach, we offer ‘hands-on’ Treasury Middle-office support, where we are responsible for, |
|
|
|
We can also outsource front office execution, based on a customized Mecklai-client technology interface with strong, integrated MIS, and take complete responsibility for a client’s FX risk management function to consistently deliver agreed performance benchmarks. |
|
Subscription Benefits
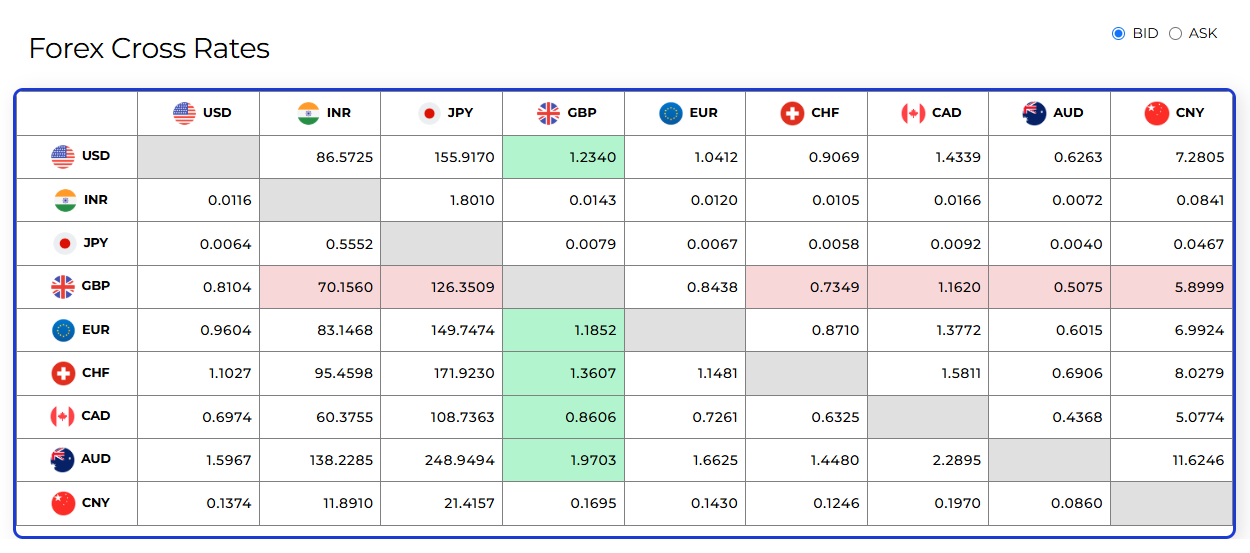
| Forex Cross Rates |
| Global Economic Calendar |
| Forward Rate Calculator |
| Historical Spot Rates |
| Daily FX Trends |