

Mecklai Graph of The Week
The USD/INR surged to a fresh record high of 95.96 this week, driven by escalating US–Iran geopolitical tensions that briefly pushed Brent crude to $115/bbl before retreating toward $100/bbl on slimmed hopes of a diplomatic framework involving Iran's nuclear enrichment moratorium and partial US sanctions relief. While the proposed deal reduced some energy risk premiums, persistent disagreements over Iran's uranium stockpile and Strait of Hormuz security keep escalation risks priced in, sustaining dollar demand against the rupee amid high oil prices near $103–104/barrel.
India's fundamentals face mounting pressure with foreign exchange reserves declining $7.79 billion to $690.69 billion in the week ended May 1, 2026—down from an all-time high of $728.49 billion in late February before the Middle East conflict triggered RBI dollar sales to support the rupee. The current account deficit widened to $13.2 billion (1.3% of GDP) in Q3 FY26, trade deficit expanded to $20.67 Billion in March as US exports weakened, and the rupee's average in May stands at 94.85 compared to April's 93.40, with record FII outflows of ₹1.92 lakh crore since January compounding the depreciation pressure despite RBI's deployment of FCNR(B) deposits and FX swaps to smooth volatility without aggressively defending 95.
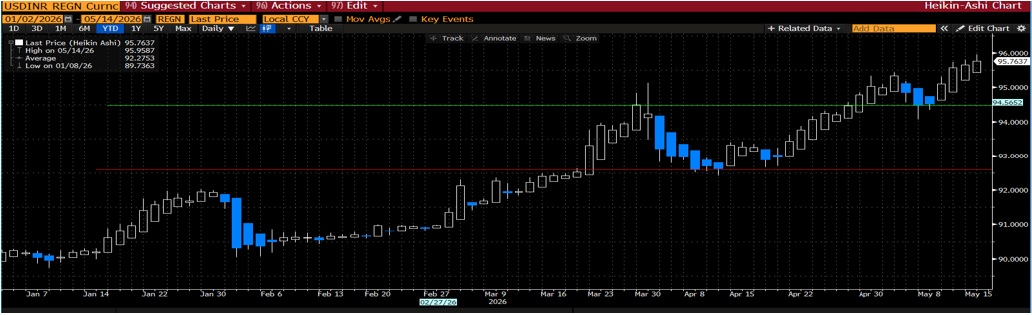
USD/INR traded within a May range of 94.24–95.97, closing at 95.76/77 on May 14 with resistance at 95.95–96.00 and support at 95.00–94.24; the pair will likely stay in 95.00–96.50 unless Iran talks collapse pushing oil above $110 and USD/INR toward 97–98, or a trade resolution with Brent dropping below $90 drives the pair lower to 93–94.


